

This client provides accounting services to companies, responsible for budgeting and invoicing. Their Excel-based system trapped them in a cycle of repeated errors, making routine tasks difficult and creating problems when reconciling data.
The client presented all the spreadsheets used in daily operations, and the key actions of the company’s usual activities. The main tasks, indicators used, and alerts required for manual reviews were clearly identified.
The first design decision was to separate the input from the report, since this wasn’t possible in the spreadsheet but was a desired outcome. This way, each user level had access only to the information needed to complete their tasks and couldn’t edit sensitive information and formulas, which was the main cause of errors in the current system.
With all this information, I created a simple list in a text document with the screen names and the editable or visible information on each one, simplifying the number of screens and their content to the bare minimum.
Then, I identified the different user levels required and what information each one should access. Some common screens only display part of the information for some users.
User level
- Admin
- Accountant
- In-house data entry
Key Screens
- Login
- Users management (add, edit, remove, assign to client company)
- Companies’s management (add, edit, archive)
- Company information entry and review
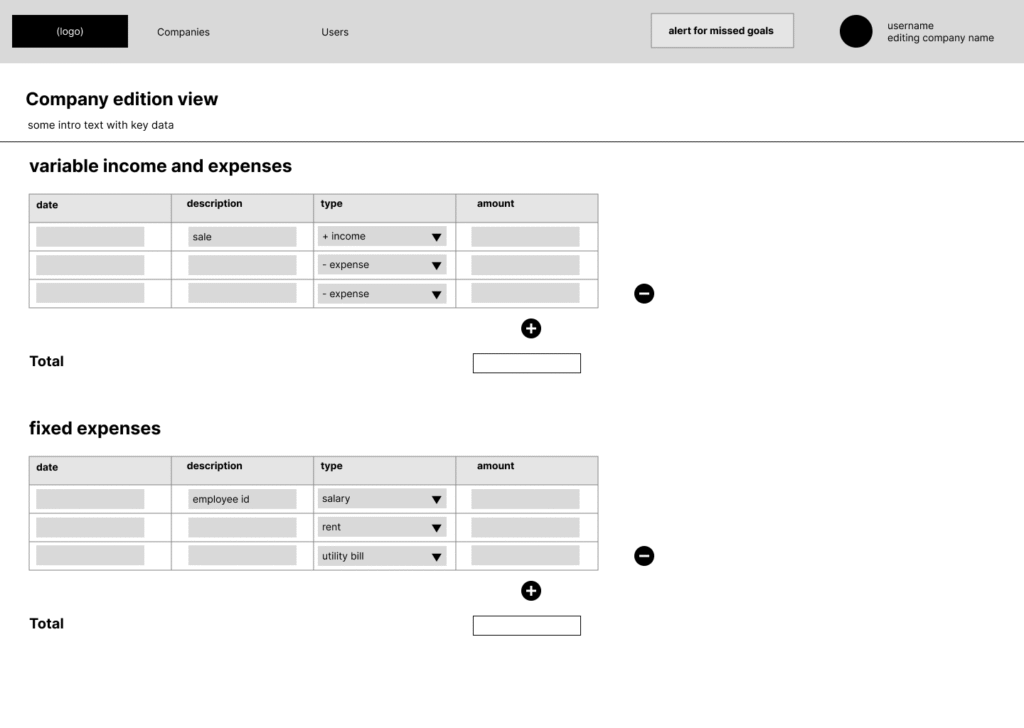
After validating the content with the client, I proceeded to create the wireframes for the first version. I translated that text document into wireframe screens, which were shared with the client for validation.
The client provided some modifications, such as important data that wouldn’t be part of the content itself, but rather alert messages available on different screens (gross margin, negative cash flow).
Moving forward, I proposed to create a first MVP including the login and the information edition of a company. This way, we would only have a portion of the required functionality, but it would still provide a useful product for the client.
The next MVP allowed for the creation and editing of companies, the assignment of users to those companies, and the separation between fixed and variable expenses.
A visualization of the fixed expenses was left on the company screen to support the reports. Additionally, a table system was added to full screens, allowing the user to choose which columns of data to display or hide as needed, keeping all the information available and allowing for detailed analysis of the information.
After implementing the system, the error reduction was very significant, although difficult to quantify. Reporting became more efficient, as there was no need to spend time reviewing all the spreadsheets to find errors and track down deleted formulas and the data that should have been replaced.
It also allows for the generation of more complex reports that allow companies to make strategic decisions with real and complete data.